

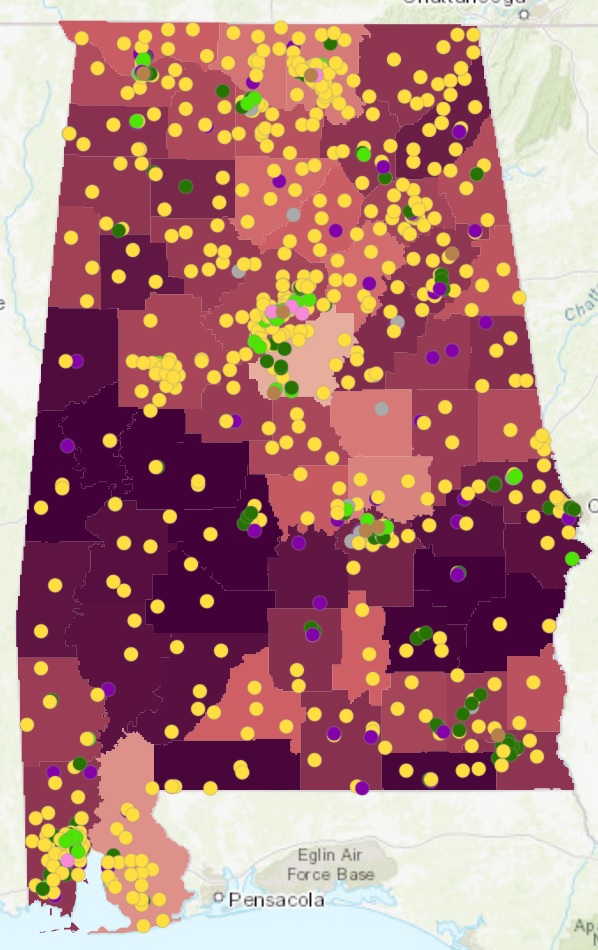

Alabama’s Child Care Roadmap Project includes child care mapping to better understand the current supply of child care throughout the state. The maps also show Head Start and Early Head Start programs.
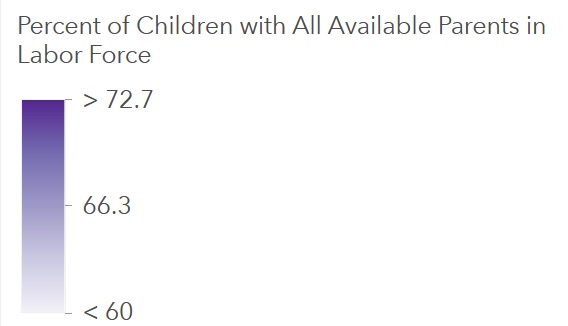
Colored backgrounds.The maps are set to U.S. Census Bureau data that shows children in families where all parents are working. Viewers can also choose to see a background layer reflecting children in poverty or a background layer reflecting the percentage of children in homes where Spanish is spoken at home.
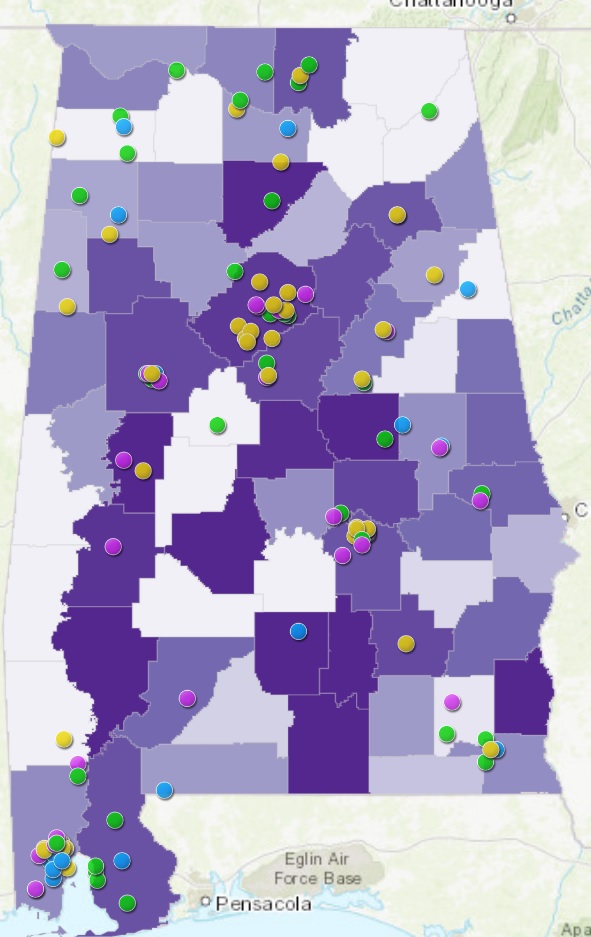
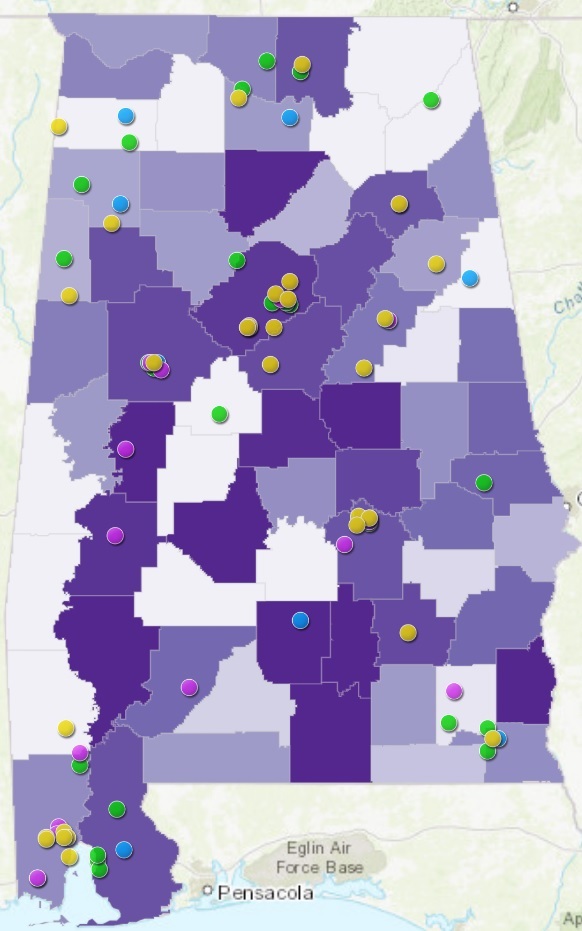
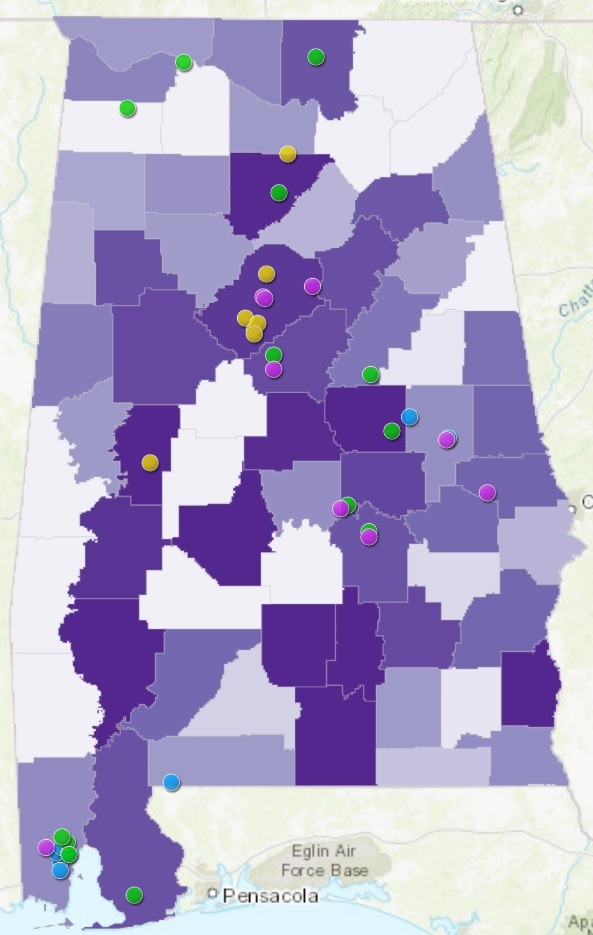
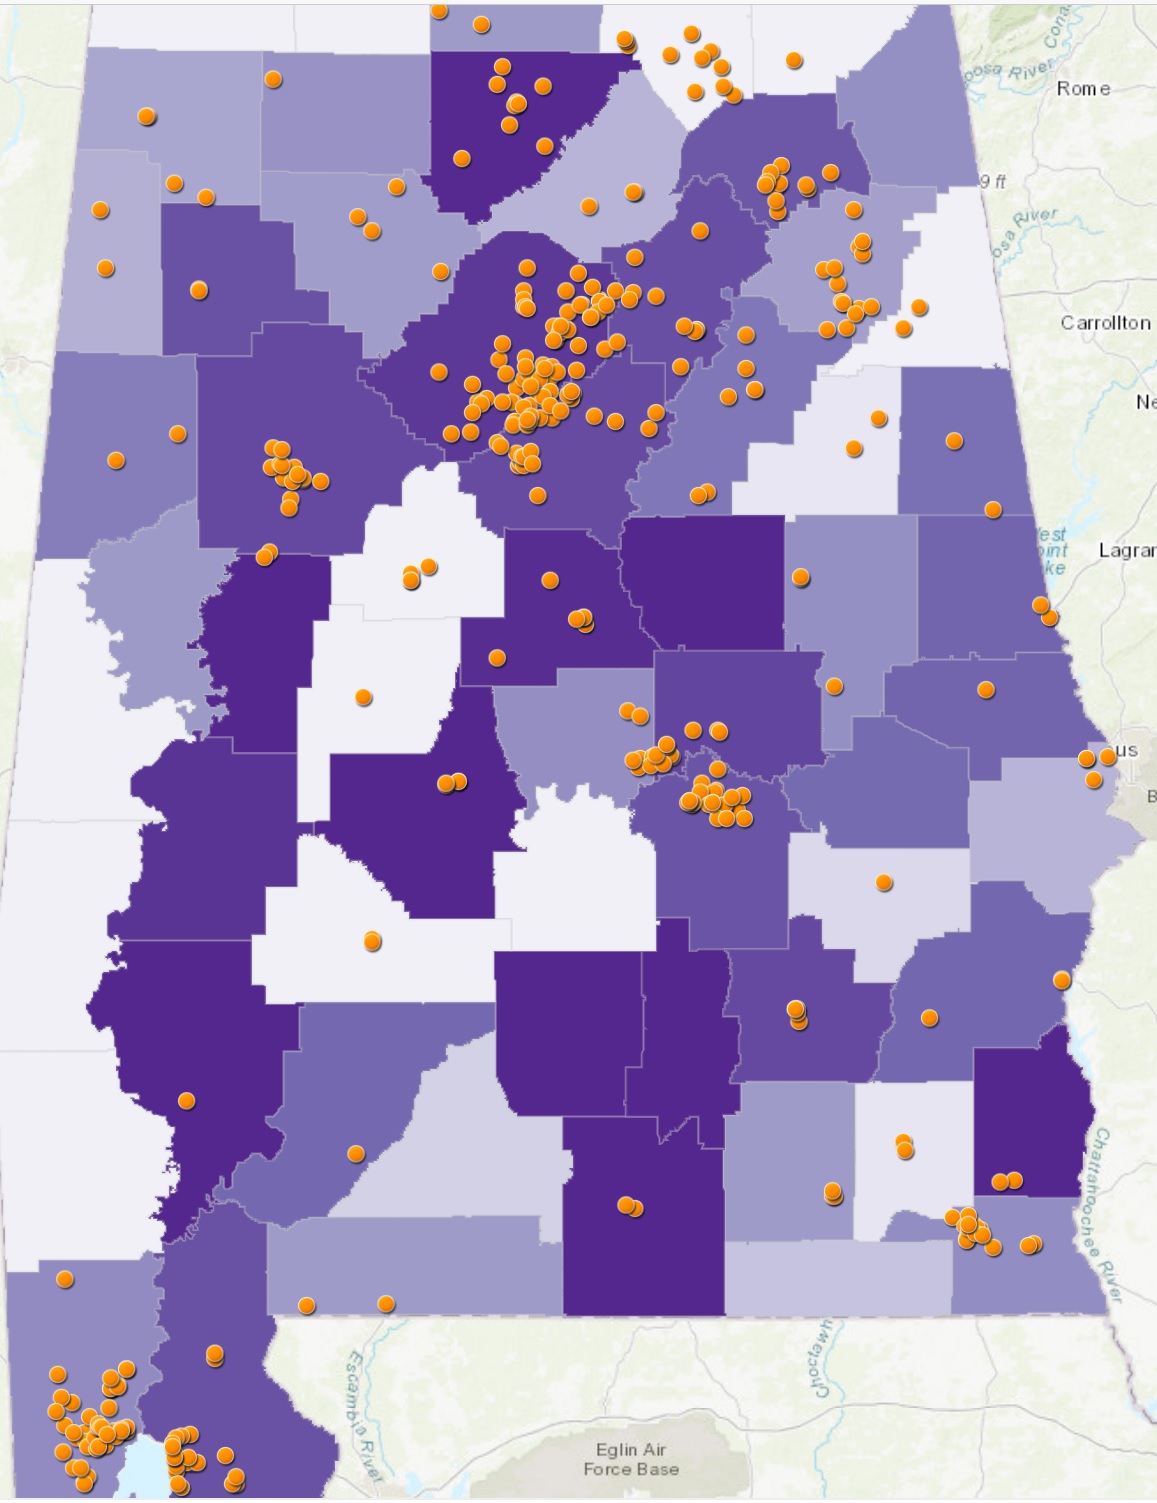
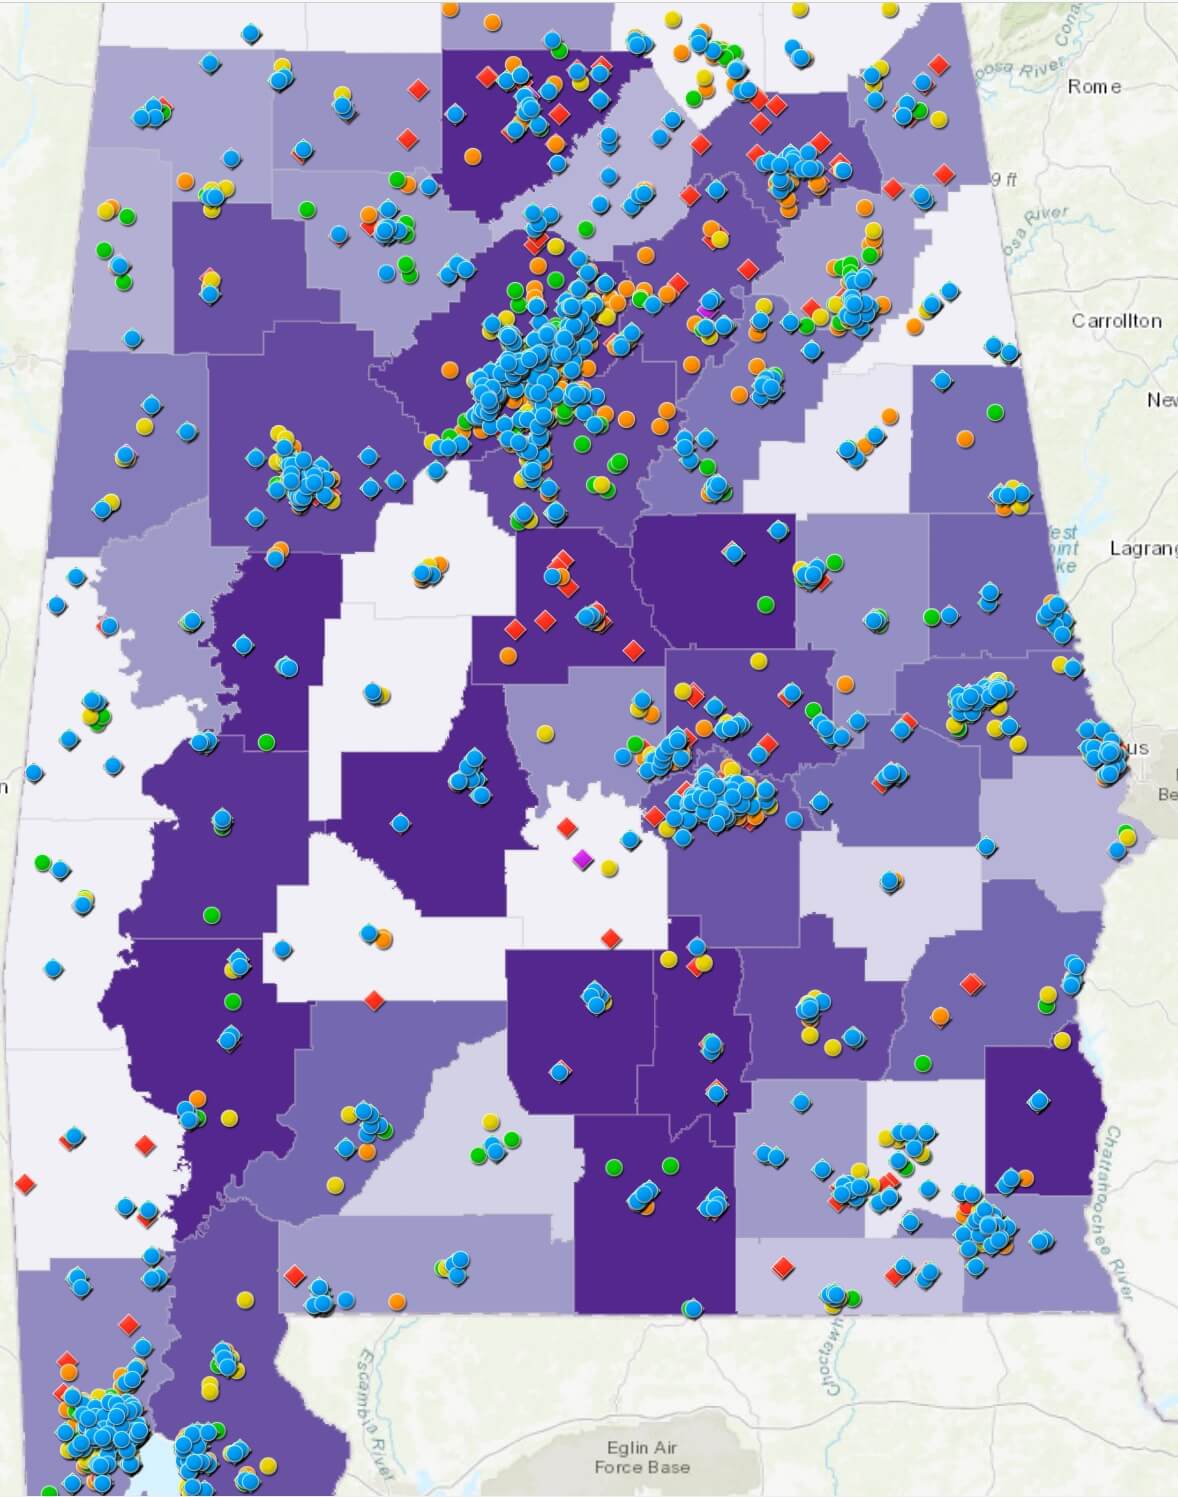
Children in Working Families. The darker the shade of purple, the greater the percentage of children in working families. This is referred to as a working families layer.
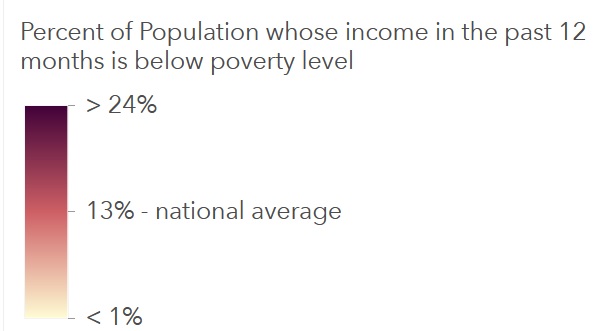
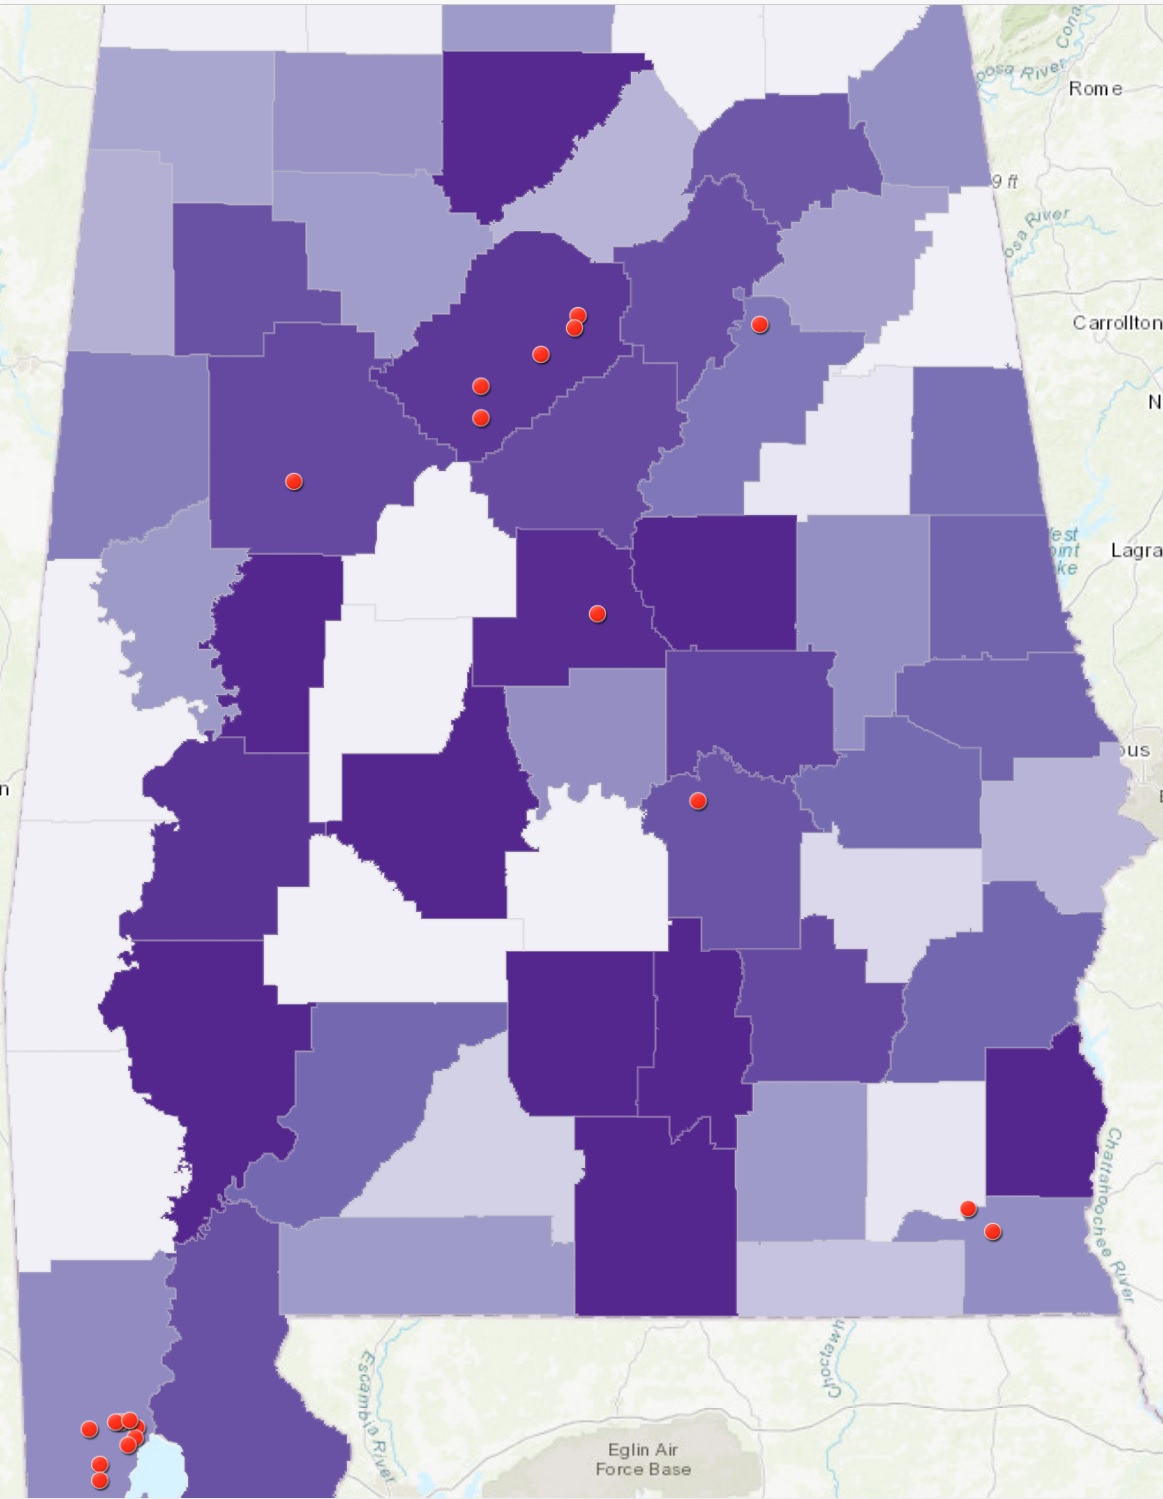
Children in Poverty. The darker the shade of red, the greater the percentage of children living in poverty.
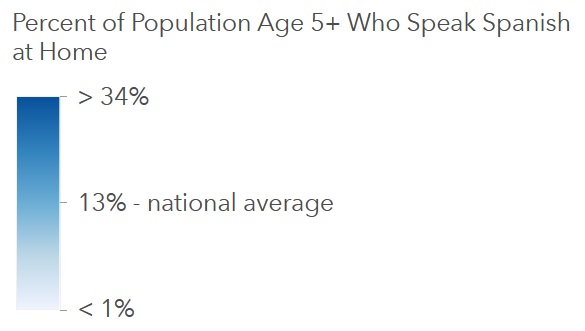
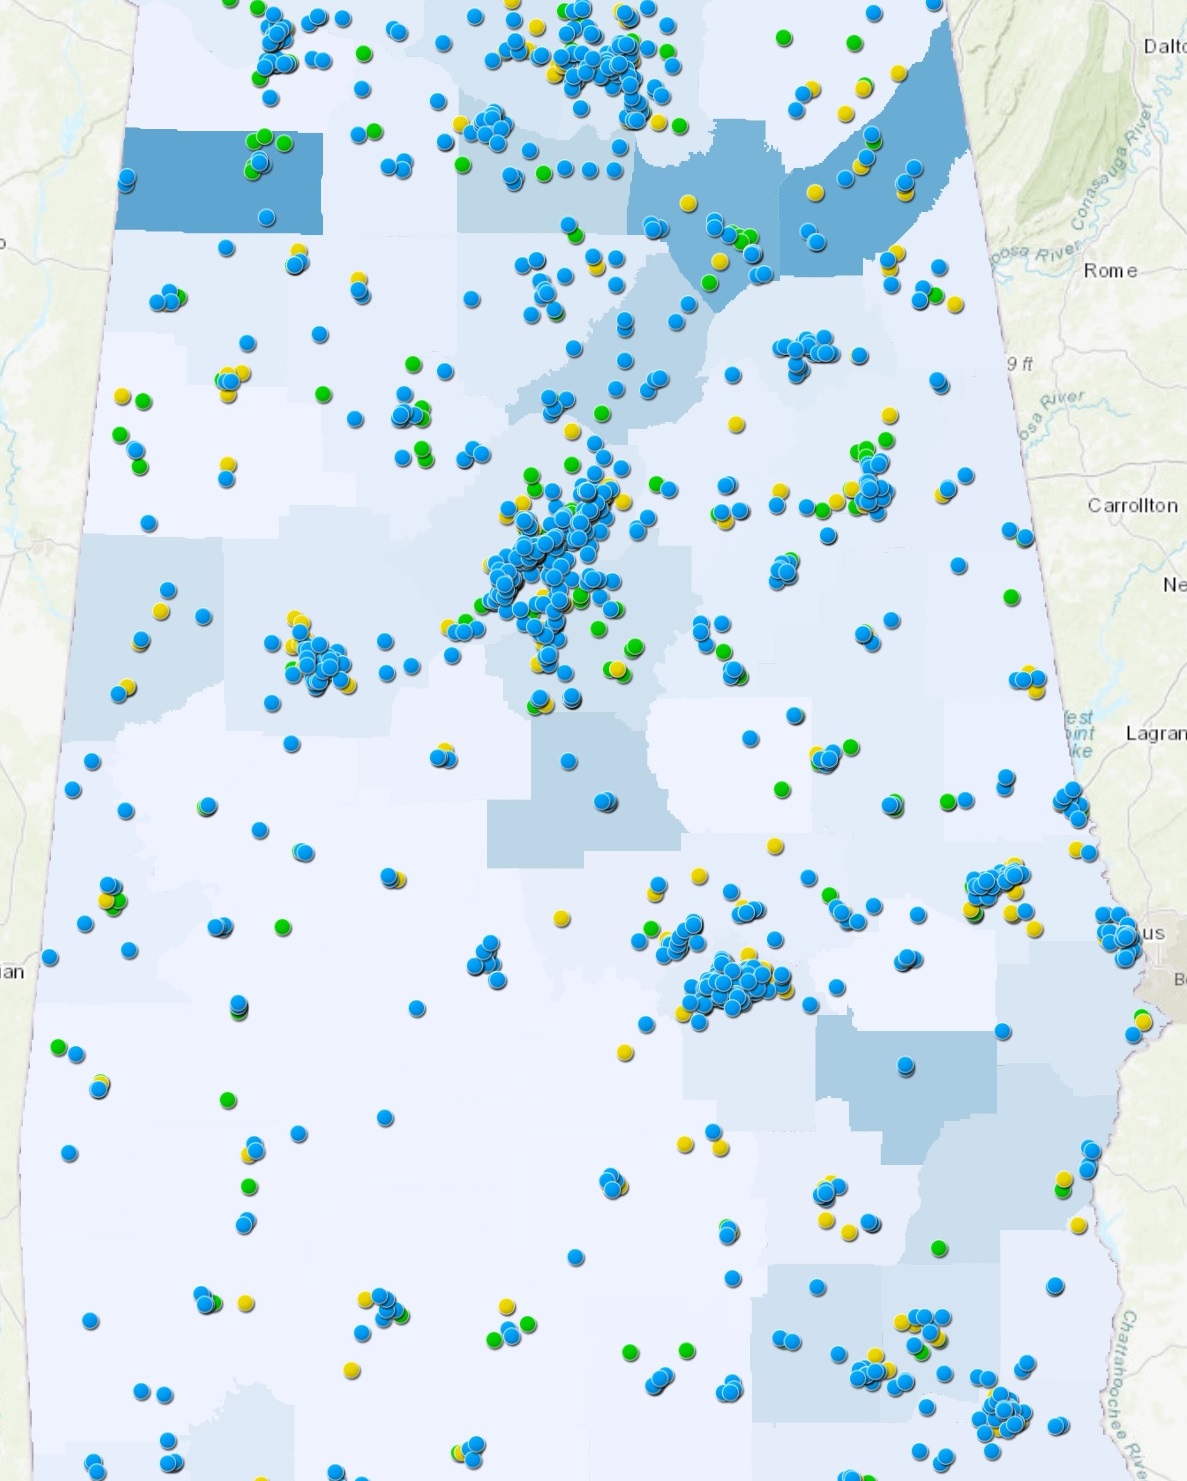
Children in Families Where Spanish is Spoken at Home. The darker the shade of blue, the greater the percentage of children in families where Spanish is spoken at home.
Your view of the interactive maps below can be customized by checking or unchecking the features you would like to see.
Click on the map to open and view the programs in each type of care category
Zoom in to see counties, communities or neighborhoods
Click on the symbols/colors in the map to see a pop-up box with program details (program info, census data)
On the left panel, view the “legend” to see the color coded symbols for types of child care
On the left panel, click on “content” to check or uncheck various categories (some maps are pre-set – for example, centers serving infants, but you can still uncheck or check items as you wish)
Children in working families have a purple shade (the darker the purple color, the greater the percentage of children in working families).
Poverty levels are reflected with various shades of red (the darkest red indicating highest poverty).
Homes with children where Spanish is spoken in the home are reflect in blue (the darkest blue has the greatest percentage of Spanish speaking homes).
Map loading time may take a few seconds so be patient!
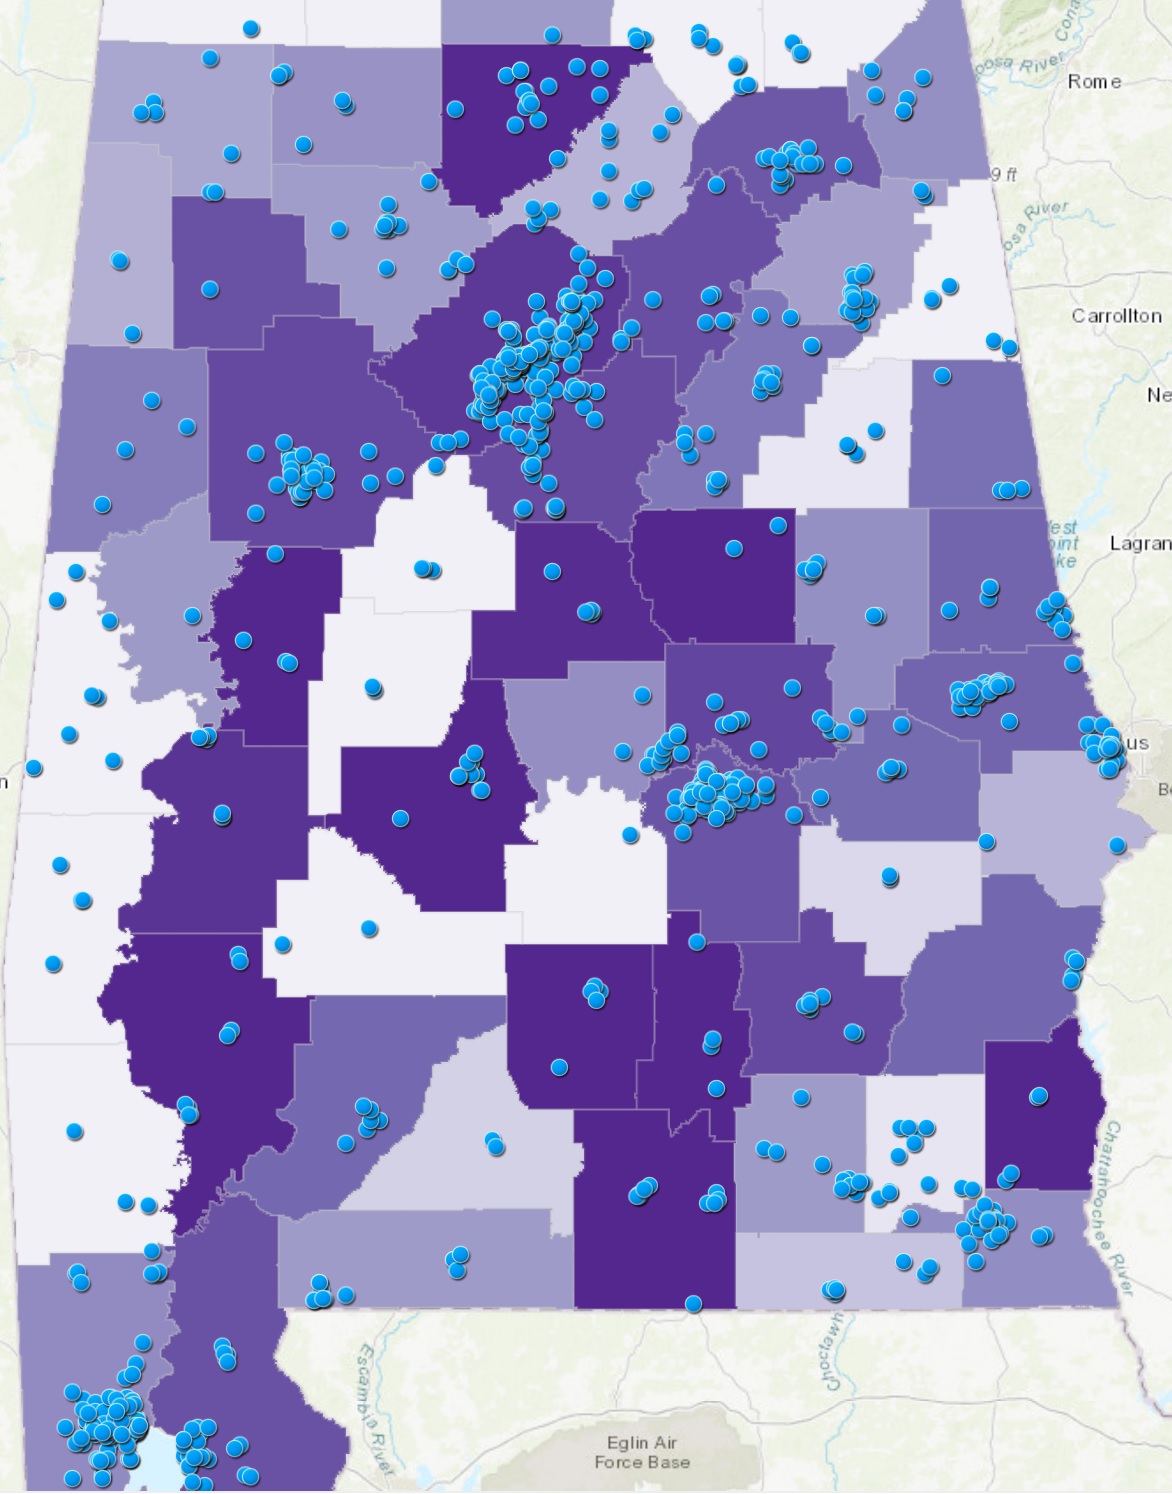
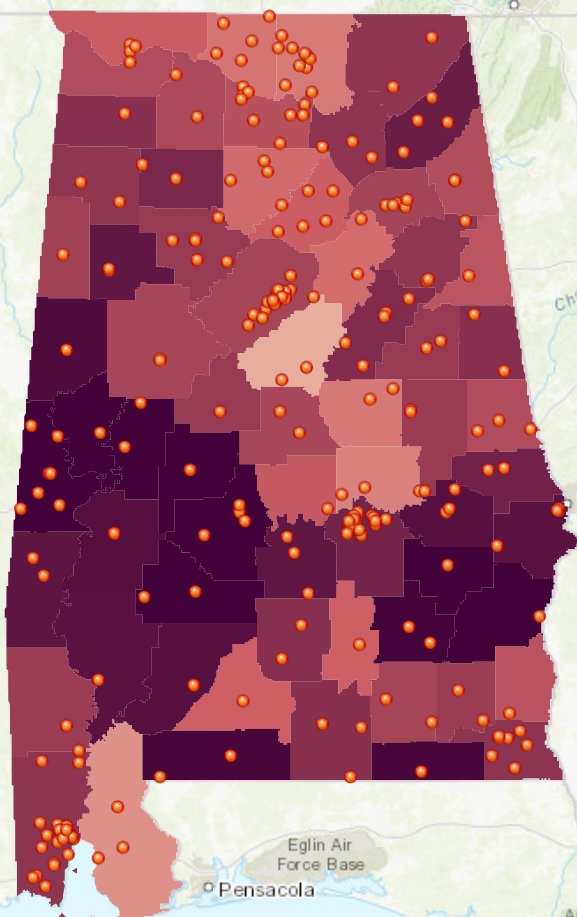
Child Care Centers Offering Infant Care
Click here to see child care centers that offer infant care in Alabama.
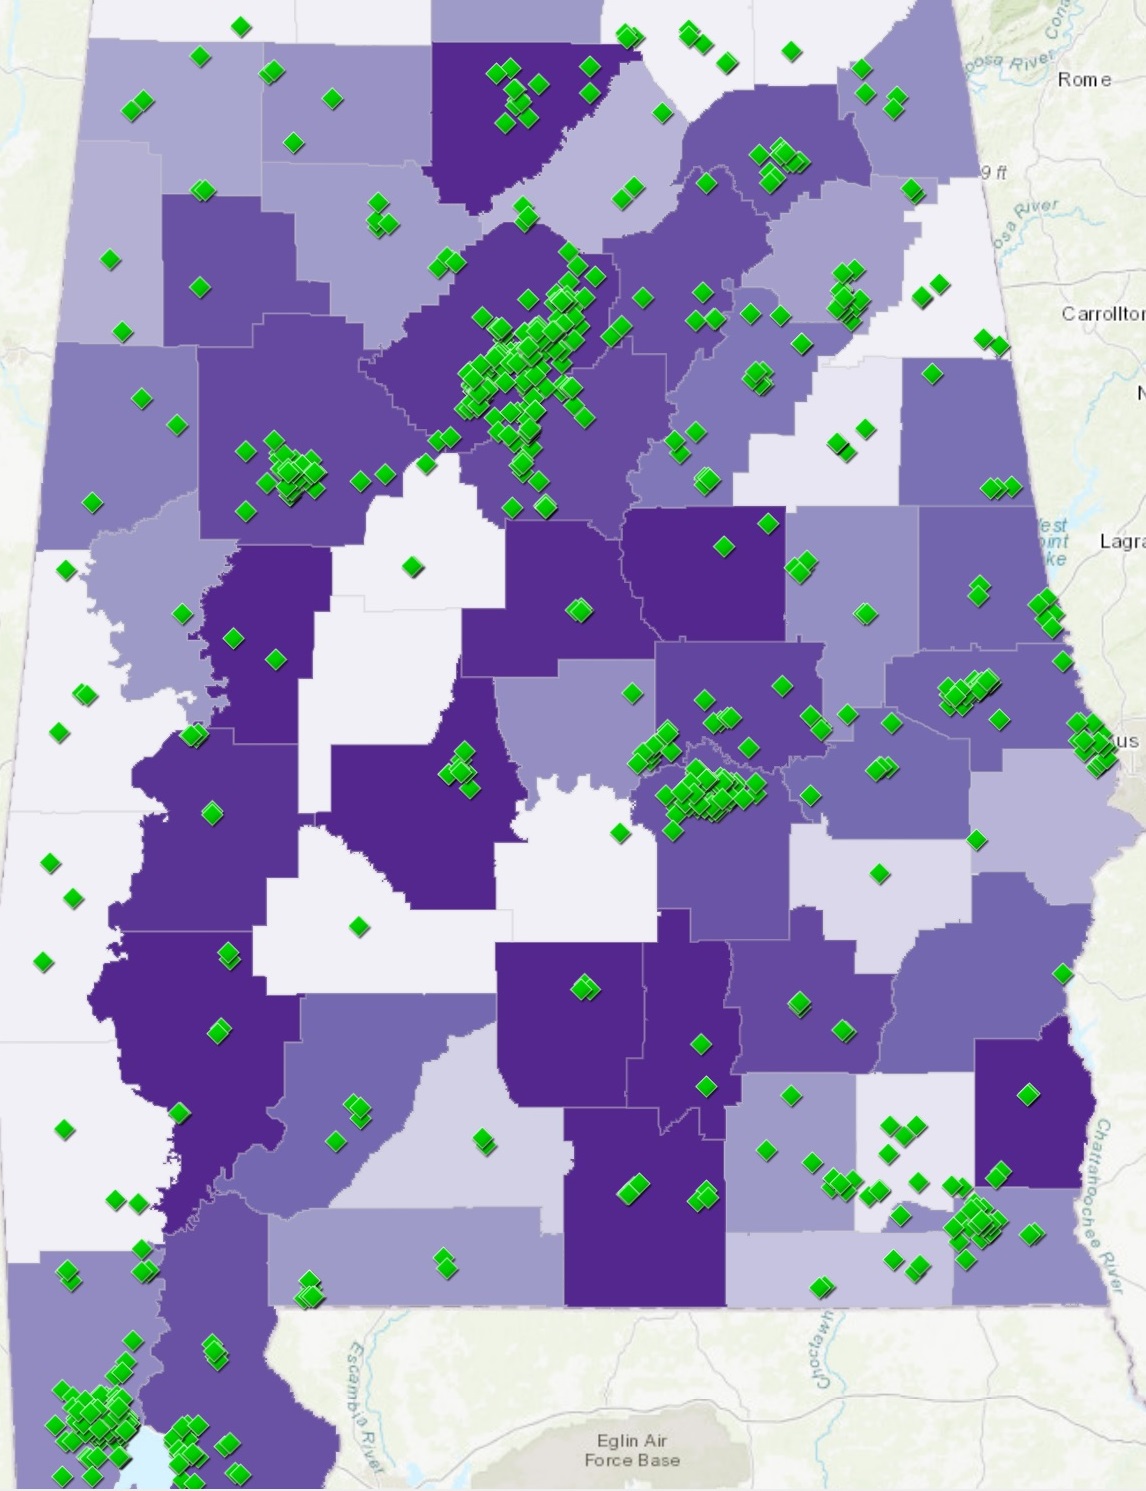
Licensed Family Child Care Homes and Group Child Care Homes
Click here to see licensed family child care homes and group child care homes in Alabama.
Licensed Family Child Care Homes and Group Child Care Homes
Click here to see licensed family child care homes and group child care homes. Click on “content” in the left-hand column once you open the map. Click off the layer related to working parents. Click ont he layer related to poverty, which will reset the background color to red shading.
Background Explainer: Children in Working Families, Levels of Poverty, and Children in Families where Spanish is spoken at home.
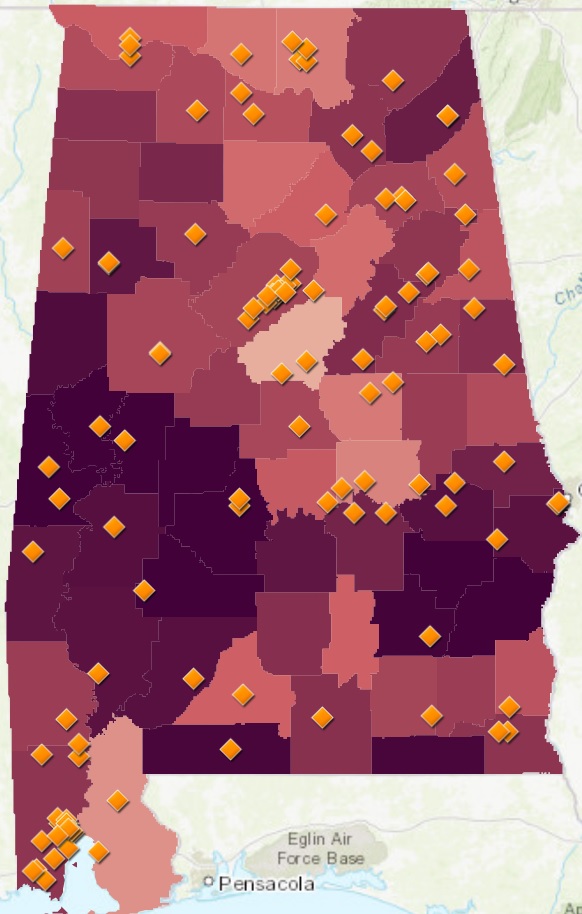
Head Start and Early Head Start Programs
Click here to see Head Start and Early Head Start programs in Alabama.
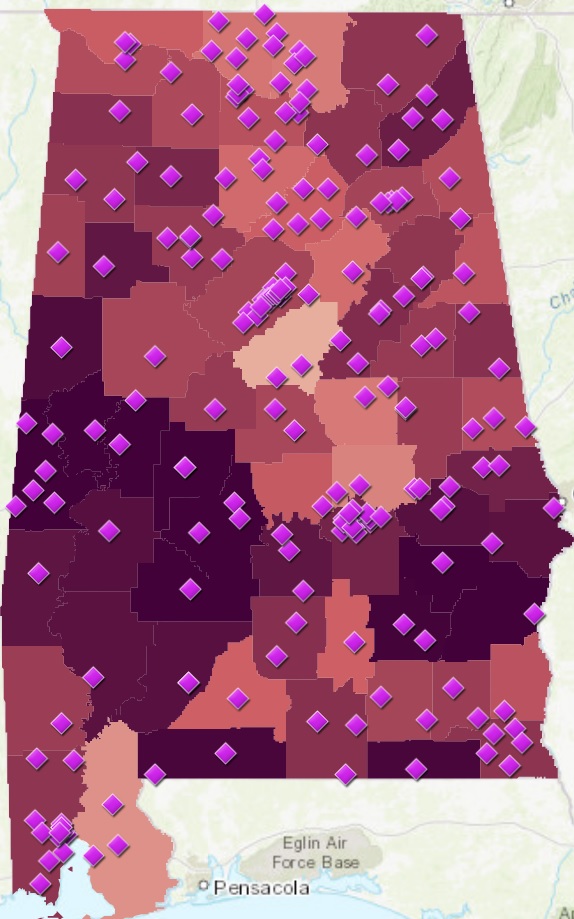
Child Care Centers Participating in the Child & Adult Care Food Program
Click here to see licensed child care centers participating in the Child and Adult Care Food Program (CACFP) — the federal food program that reimburses child care programs for nutritious meals and snacks.
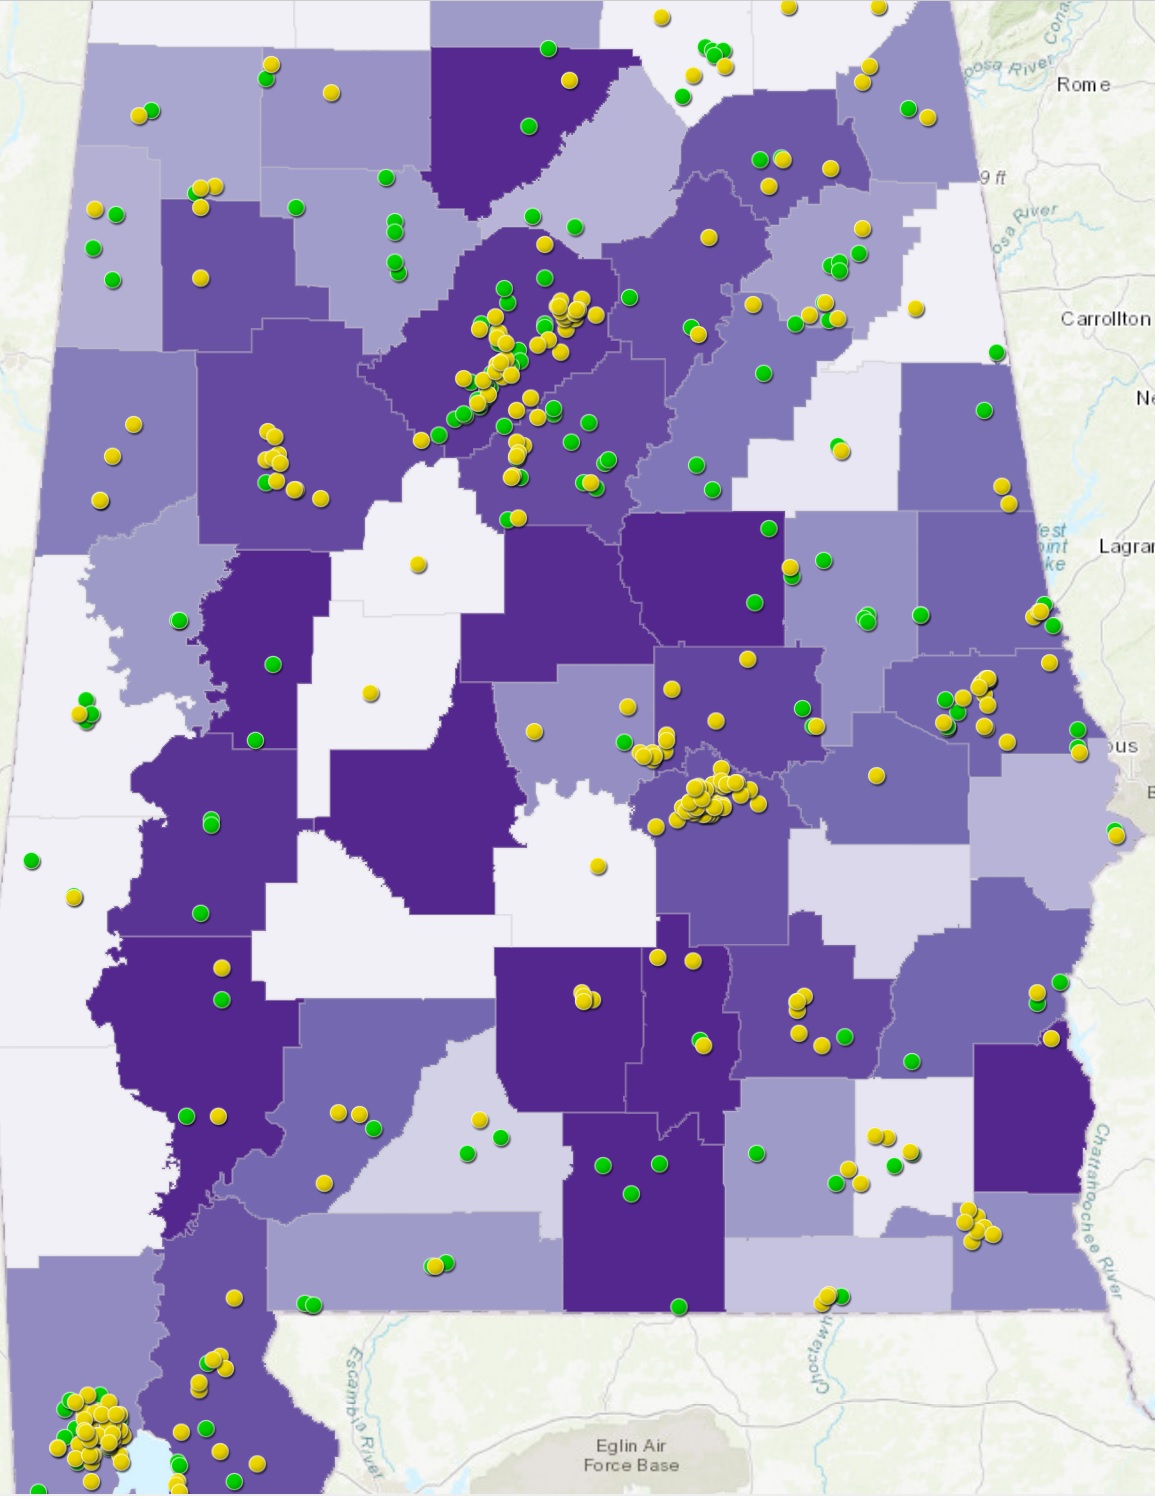
Alabama Quality STARS Programs Rated 2 – 5 (May 2023)
All Programs Participating in Quality STARS Rated 2-5
Click here to see all programs participating in Quality STARS Rated 2- 5 (May 2023)
Child Care Centers Participating in Quality STARS Rated 2-5
Click here to see child care centers participating in Quality STARS Rated 2- 5 (May 2023)
Group & Family Child Care Homes Participating in Quality STARS Rated 2-5
Click here to see Group homes and Family Child Care homes participating in Quality STARS Rated 2- 5 (May 2023)
License Exempt Programs Serving Children with a Child Care Subsidy
Click here to see license exempt programs serving children whose care is paid for with a subsidy in Alabama.
Licensed child care programs by neighborhoods where Spanish is spoken at home
Click here to see child care centers and licensed family child care homes and group homes against a background layer showing neighborhoods where Spanish is spoken at home.
Alabama First Class Pre-K Programs
Click here to see the locations of Alabama First Class Pre-K by type of organization (public school, private child care center, Head Start, etc.).
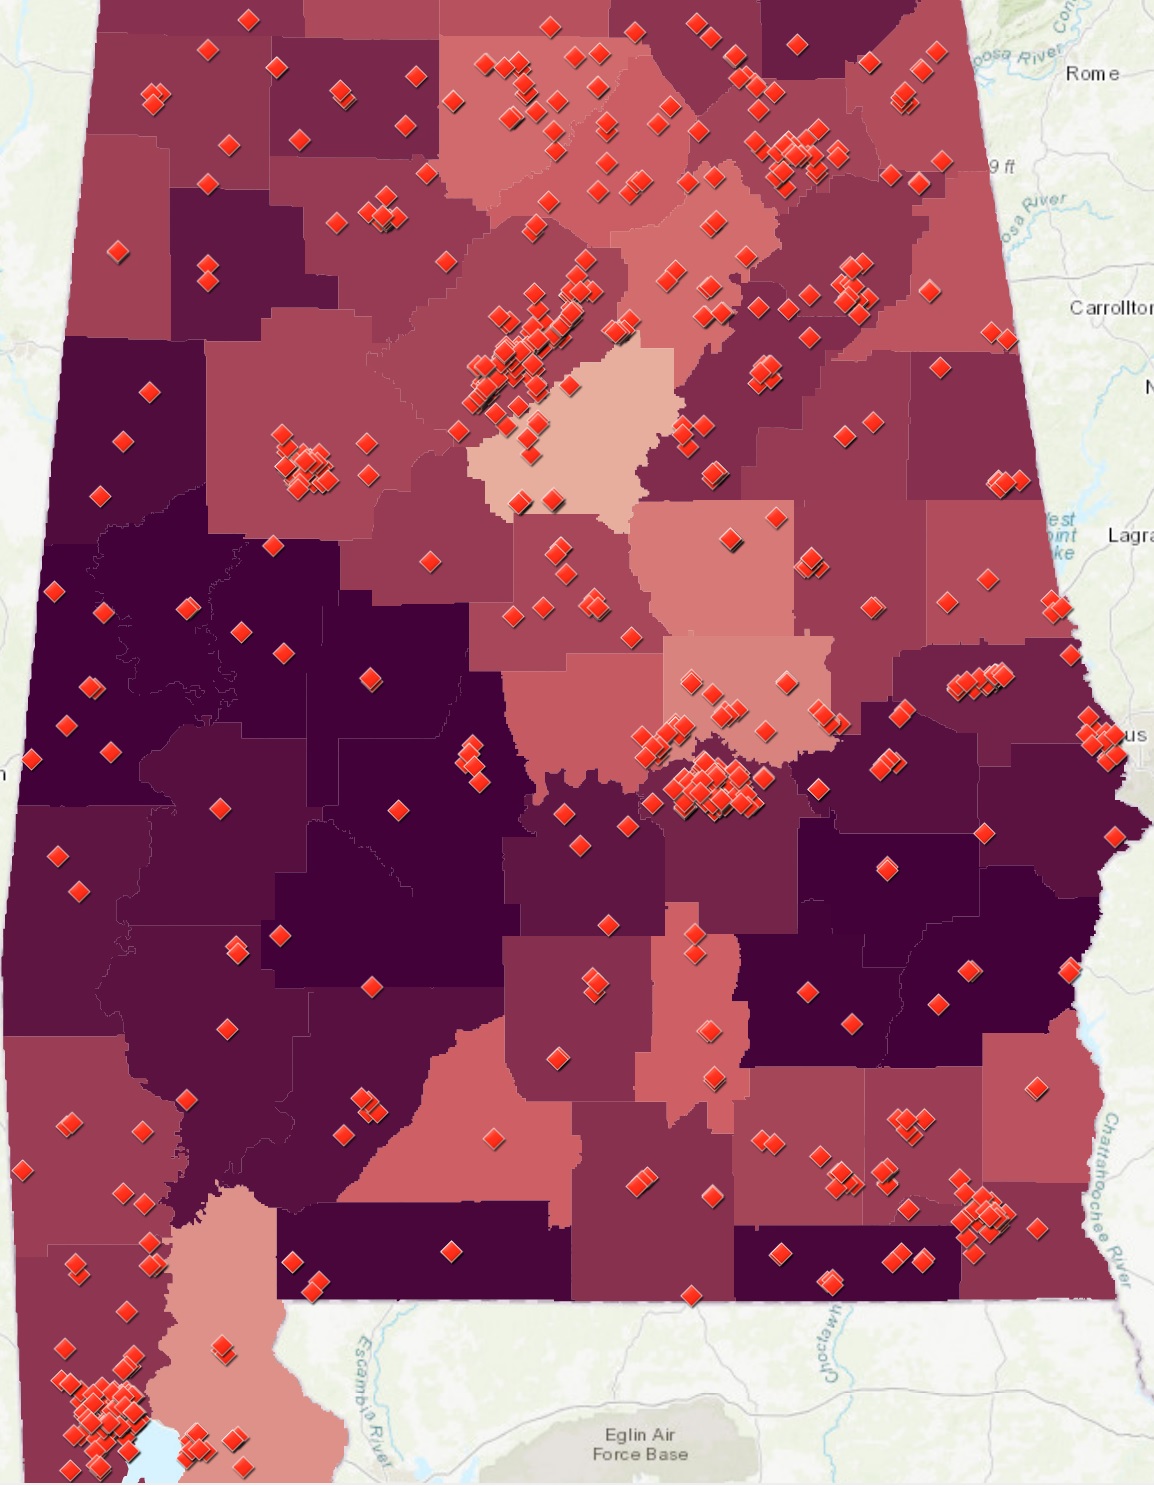
All Child Care Programs
Click here to see all child care programs in Alabama. It takes a few minutes for all the variables to load. Visitors may want to unclick all the layer options (types of child care) once the map fully loads (click “content” on the left-hand side to click or unclick variables), and click on each layer you want to add to the map. Zoom in to check out your neighborhood!
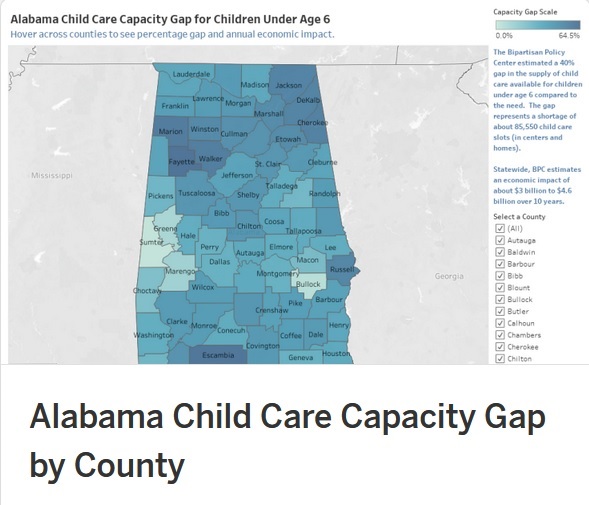
Alabama Child Care Supply Gap
Click here to see the child care supply gap for children under age 6 in Alabama by county. The gap in each county is presented by the percentage gap between supply and potential need as well as by the slot shortage estimate. In addition, the annual economic impact the supply shortage has on each county is listed. The data is from a 35-state analysis conducted by the Bipartisan Policy Center.
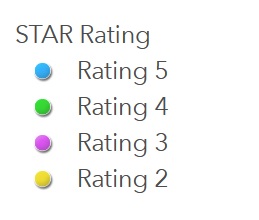
Star ratings within the maps are color coded by rating
Sources: Alabama Department of Human Resources, Alabama Department of Education, U.S. Census Bureau 2021 American Community Survey, 1 Year Estimates.